|
ProcessAnalyzer |
Scroll Previous Topic Top Next Topic More |
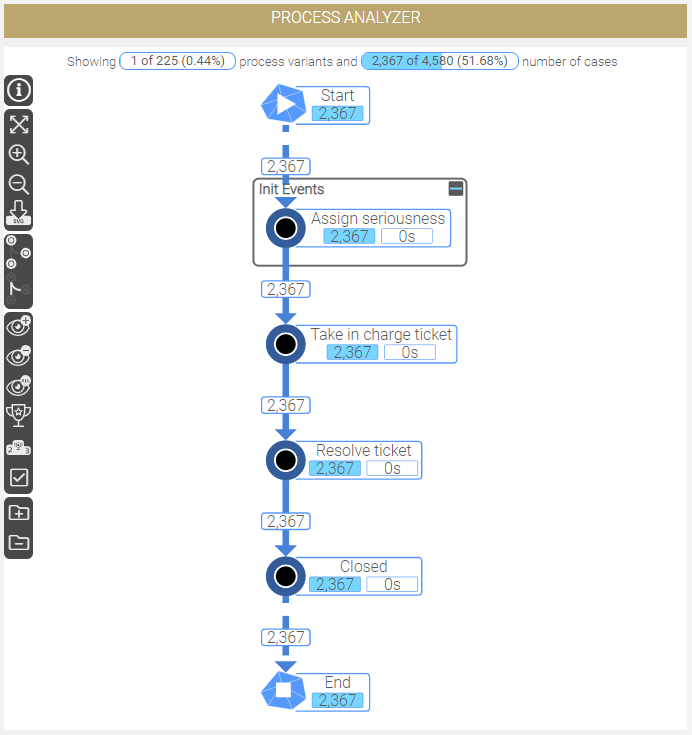
The ProcessAnalyzer displays the process event by event and allows interactive analysis activity by activity and edge by edge. Different process performance indicators (PPIs) are shown to present the process quality. See the explanations below to understand how to interact with this visualization:
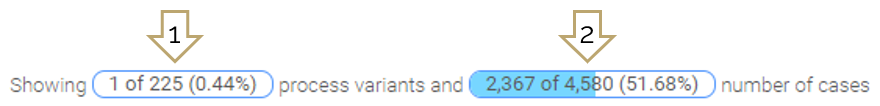
Top Bar:
|
|
1: |
Shows the number of process variants that you actually see. You can change this with the left bar of the Process Analyzer. In this case, 1 process variant represents 51.68% of the total number of cases (regarding the current selection). The first process variant includes always the most cases (Ticket (CaseID)), the second most, etc. |
2: |
Shows the number of visible cases in comparison to all cases that correspond to the actual selection. |
In short: One process variant is visible and 2367 cases relate to this process variant. |
|
Left Bar:
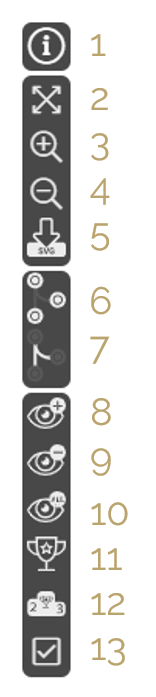 |
1: |
Information: Show additional process information (useful for validation). |
2: |
Center Viewport: Center the Process Analyzer. |
|
3: |
Zoom in |
|
4: |
Zoom out |
|
5: |
Export as SVG |
|
6: |
Selection of node measure that is used for coloring the node (frequency, median event duration, the proportion of cases). The higher the value of the measure the darker the color. |
|
7: |
Selection of edge measure (frequency, median idle time, the proportion of cases): It changes the edge measure displayed in the label. The higher the value of the measure the thicker the edge and darker the color. |
|
8: |
Show more: Adds one process variant to the visualization, hence, you will see more cases. |
|
9: |
Show less: Removes one process variant. |
|
10: |
Show all: Shows all process variants of your process (max: 1000). |
|
11: |
Most common: Shows the process variant that contains the most cases. |
|
12: |
Top 10: Shows the 10 process variants that contain the most cases. |
|
13: |
Apply selection: Uses the visible process variants of the process visualization as a selection (on the field ProcessPath) for the whole application. |
Selection:
You can click on an activity or edge in the Process Analyzer to see context information. You should consider that the information displayed is dependent on the shown processes. If you want to show less, more, the top ten or the most common process variant, use the corresponding button on the left bar. |
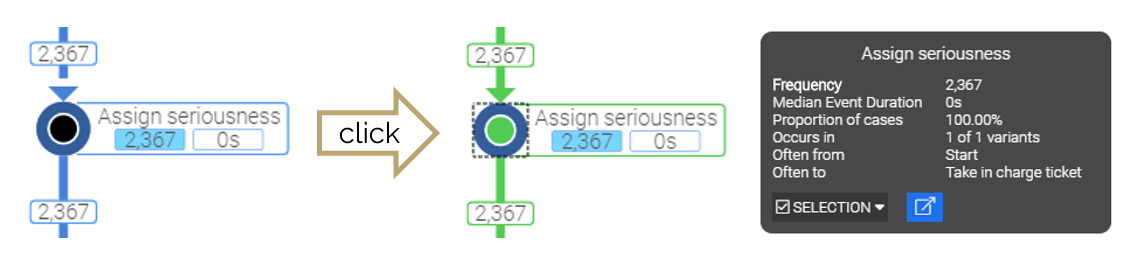 |
In the context menu is a button "SELECTION" where you can select the process variants with or without this activity or the process variants which start or end with this activity. The blue button allows you to go to the sheet "Activity Details" with this selection. |
Tutorial
Start the video below to see a short tutorial about how to use the sheet.