|
User Monitoring and Transparency |
Scroll Previous Topic Top Next Topic More |
The Management Console provides applications for monitoring system performance and usage of Qlik Sense Enterprise on Windows server nodes and for monitoring licence usage.
The Operations Monitor and Licence Monitor apps are accessed via the QMC start page. The Monitoring apps link under GOVERNANCE in the navigation area takes you to the Monitoring apps stream, where you can start the individual apps.
The Operations Monitor app provides information on hardware utilisation, such as server memory and CPU usage, active users and reload task activity. It also provides summarised and detailed information on errors, warnings and log activity in the Qlik Sense server environment that can be used for troubleshooting.
The License Monitor app tracks licence usage and makes it easy to monitor changes to licence allocation.
Additional monitoring apps can be imported from: %ProgramData%\Qlik\Sense\Repository\DefaultApps\.
Sessions
The additional monitoring apps include:
•The Log Monitor app displays almost all available log data and enables trend analyses and troubleshooting.
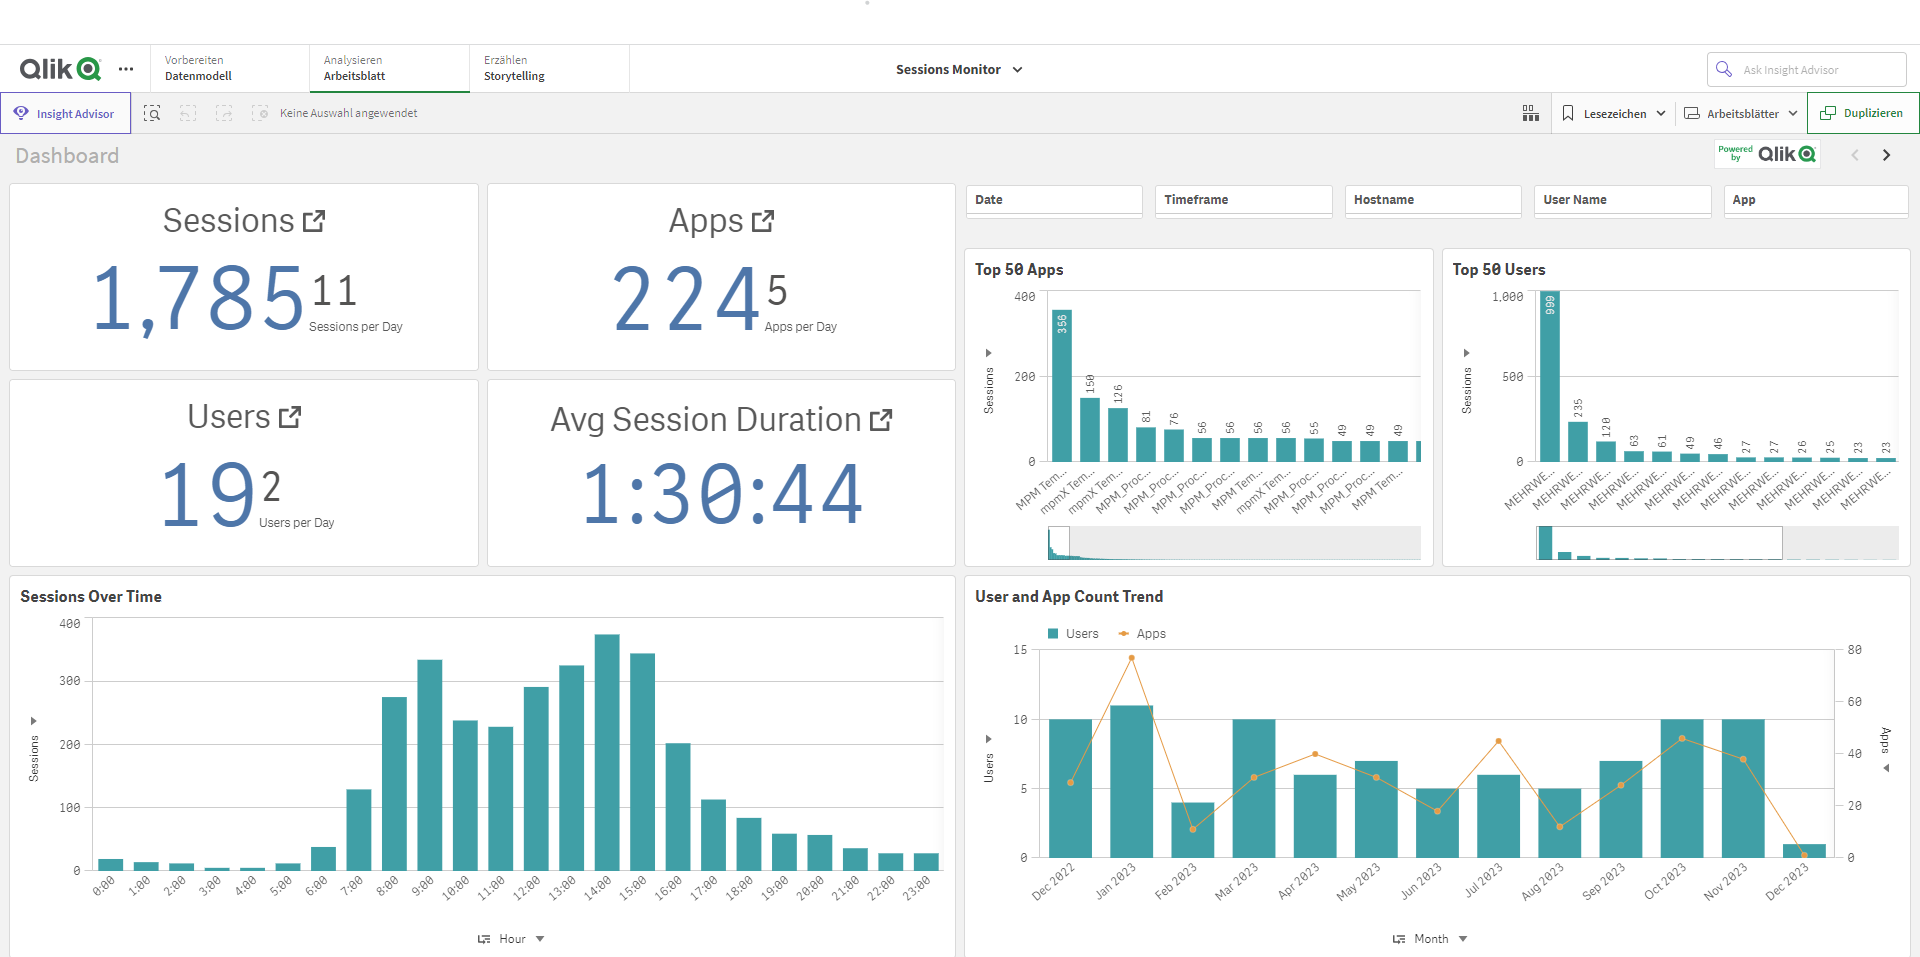
•The Sessions Monitor app displays log data on the use of apps.
•The Reloads Monitor app displays detailed information about reload data, both from the QMC and from apps opened in the hub.
•The App Sense System Performance Analyser shows the performance of Qlik Sense across all nodes.
•The App Sense Connector Logs Analyser provides insights into the usage and errors of specific Qlik connectors.
•The App Metadata Analyzer provides a holistic overview of all your Qlik Sense apps, including granular details of an app's data model and its resource utilisation.
The monitoring apps provide historical status and trend data. Real-time status is provided by the QMC management resources. Actions taken in response to issues detected by the monitoring apps are also performed in the QMC.