|
Visualization |
Scroll Previous Topic Top Next Topic More |
Activity |
|
•Is displayed as a so-called node in the diagram •Consists of the donut chart, the inside of the donut chart, the name of the activity and certain key figures •Key figure 1: Displayed on the left side. Default setting: Frequency •Key figure 2: Displayed on the right side. Default setting: Average processing time •Key figure 3: Displayed in the donut chart and must therefore be a relative key figure. It can be filled differently depending on the scenario. Default setting: Relative share of cases that contain this activity |
 |
Context menu of the activity |
|
•Display of the three key figures of the activity •"Occurs in": Specifies the number of displayed process variants in which the activity is contained •"Often from": Specifies the most frequent predecessor •"Often to": Specifies the most frequent successor •"SELECTION": Four selection options: 1. processes that contain this activity, 2. processes that do not contain this activity, 3. processes that start with this activity and 4. processes that end with this activity •Button 1: Jump to a stored worksheet and select the activity •Button 2: Jump to a deposited worksheet without selection |
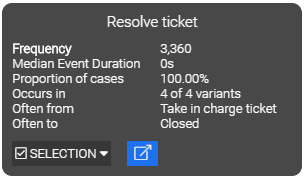 |
Edge |
|
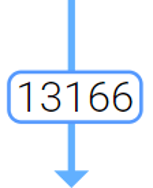
•Activity transition •Key figure: Displayed as a label. Default setting: Frequency |
 |
Context menu of the edge |
|
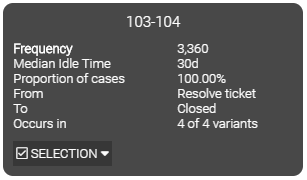
•Display of the three key figures of the edge •"From": Specifies the predecessor •"To": Specifies the successor •"Occurs in": Specifies the number of displayed process variants in which the activity is contained •"SELECTION": Two selection options: 1. processes that contain this edge and 2. processes that do not contain the edge •Button: Jump to a deposited worksheet |
 |