|
How to build a network diagram based on the EventLog |
Scroll Previous Topic Top Next Topic More |
Build a network graph based on the EventLog:
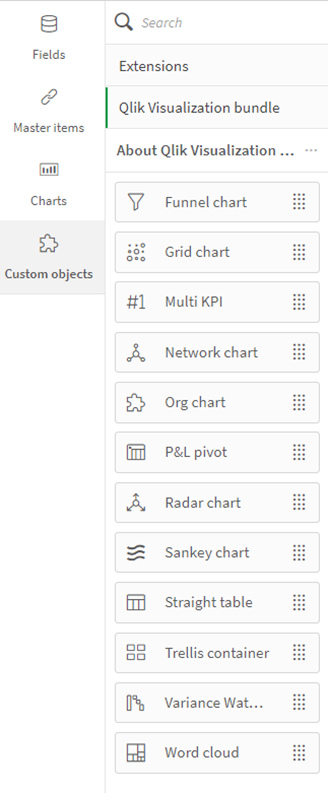
Select the network chart: Under “Extension > Visualization Bundle” and drag and drop it into your worksheet |
Click on the empty visualization and turn your attention to the configuration bar |
 |
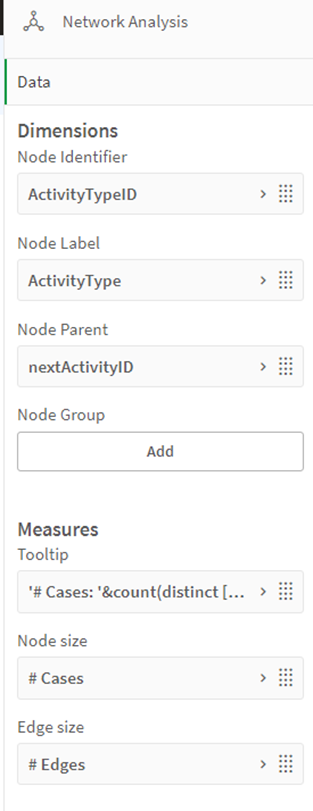 |
Make the following settings to generate the network graph based on your current EventLog:
Dimension |
Node Identifier |
ActivityTypeID |
A numerical identifier must be stored here |
Dimension |
Node Label |
ActivityType |
Displayed name in the graph |
Dimension |
Node Parent |
nextActivityID |
Field that defines the link to other nodes. In the standard analysis, the ID of the follow-up activity. |
Dimension |
Node Group |
[optional] |
A grouping can be displayed here to assign nodes to each other by color |
Kennzahl |
Tooltip |
'# Cases: '&sum(CaseCounter) |
Define here which key figure should be displayed when hovering over the nodes. |
Kennzahl |
Node Size |
# Cases |
Select a relevant key figure from the MasterItems. Optionally # Events or # Cases |
Kennzahl |
Edge Size |
count(System_nextActivityID) |
Define the thickness of the connections. |
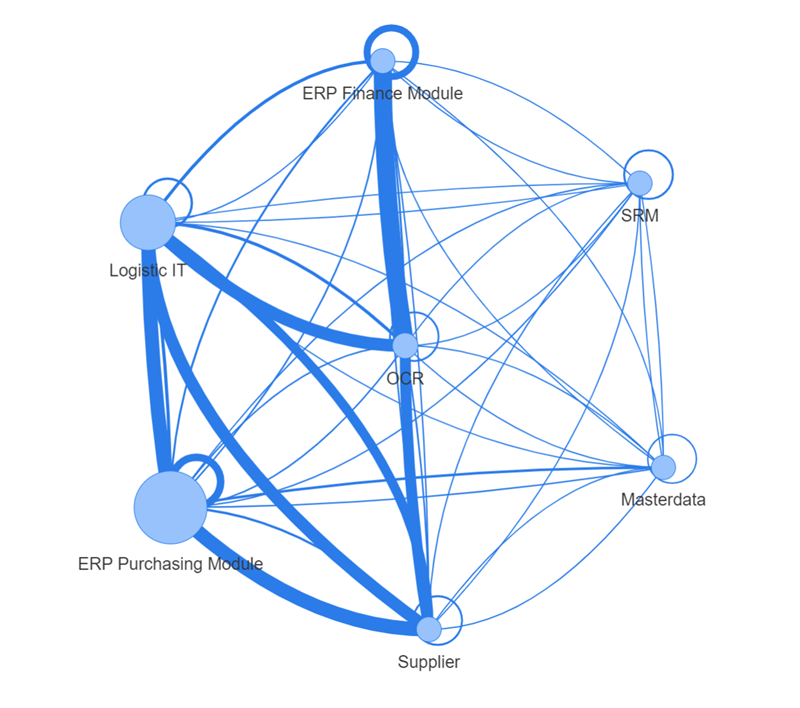
Once you have made the settings, the network graph now shows the relationships between individual activities in your EventLog. The network graph has some advantages and disadvantages compared to the classic display in the Process Analyzer.
This provides a picture between connections and frequencies independent of process paths. This can help end users to understand connections and dependencies.
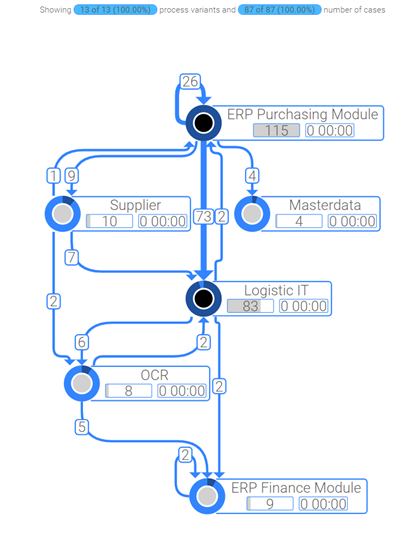
As a detailed evaluation, however, the network graph lacks display and filter options, which is why the analysis of social networks (i.e. dependencies between users, systems, organizational units) can generally achieve more valuable results with the Process Analyzer.
If you want to use the Process Analyzer to generate a more detailed graph, please read the section Resource Log.
To hide the start and end activities, the "Real Node" field can simply be filtered to "1".