|
ProcessAnalyzer |
Scroll Previous Topic Top Next Topic More |
The ProcessAnalyzer displays the process event by event and allows interactive analysis activity by activity and edge by edge. Different process performance indicators (PPIs) are shown to present the process quality.
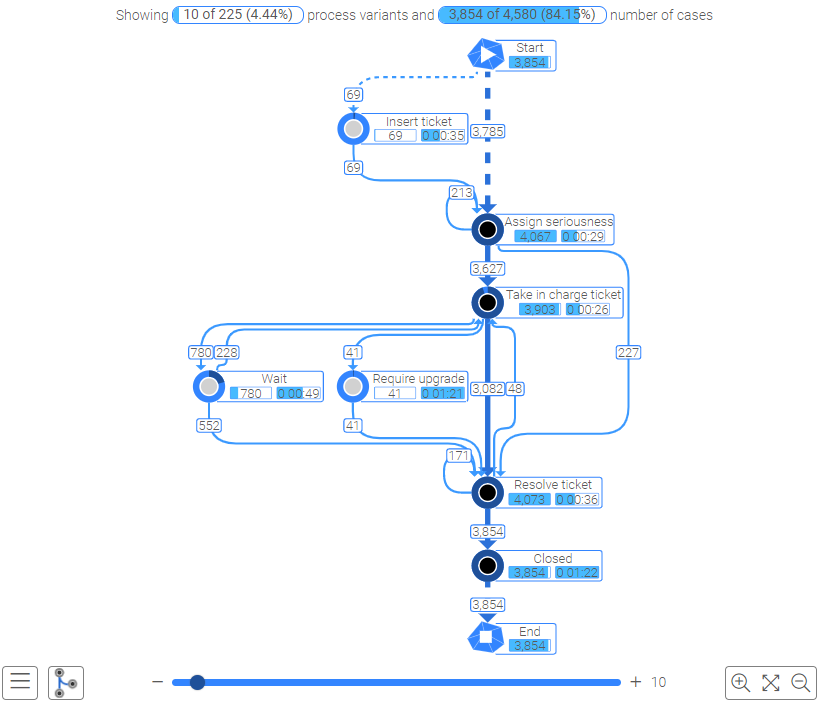
See the explanations below to understand how to interact with this visualization:
Top Bar:

|
|
1: |
Shows the number of process variants that you actually see. You can change this with the left bar of the Process Analyzer. In this case, 1 process variant represents 51.68% of the total number of cases (regarding the current selection). The first process variant includes always the most cases (Ticket (CaseID)), the second most, etc. |
2: |
Shows the number of visible cases in comparison to all cases that correspond to the actual selection. |
In short: One process variant is visible and 2367 cases relate to this specific variant out of a total of 4,580 cases in the process overall. |
|
Left Bar:
|
|
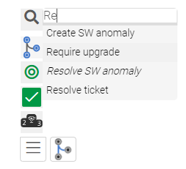
Search Bar. You can search for activities. If you click on the activity name the activity will be highlighted and the context menu will be shown for activities that are shown in the process analyzer. For activities that are currently not shown, the names are displayed cursive. When you click on such a name the activity will be filtered “With activity” (ActivityName = 1) |
|
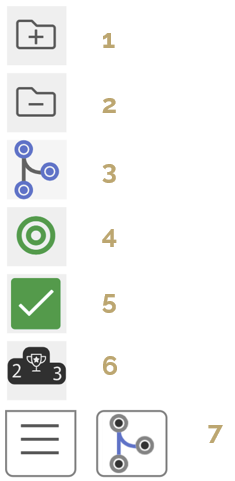
1: |
Expand Groups. |
2: |
Collapse Groups. |
|
3: |
Selection of node measure that is used for coloring the node. The higher the value of the measure the darker the color. |
|
4: |
Show entire case: rearranges the selection so that the process graph is no longer disconnected. The field case ID will be filtered on the possible cases and all other selections will be deleted. |
|
5: |
Apply selection: Uses the visible process variants of the process visualization as a selection (on the field ProcessPath) for the whole application. |
|
6: |
Top 10: Shows the 10 process variants that contain the most cases. |
|
7: |
Selection of edge measure: It changes the edge measure displayed in the label. The higher the value of the measure the thicker the edge and darker the color. |
Right Bar:
|
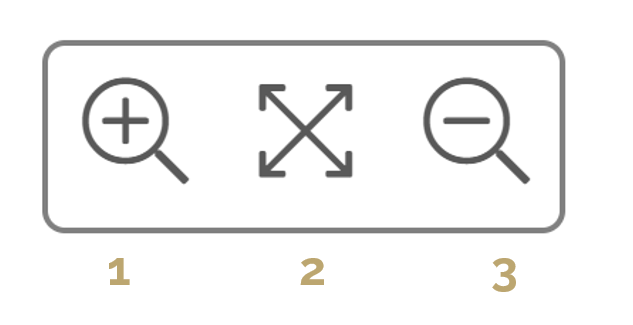
1: |
Zoom in. |
2: |
Centers the graph and adjusts the zoom level to 100%. |
|
3: |
Zoom out. |
Slider:
|
Display all process variants or select a specific number with the slider.
Note that the information displayed in the process analyzer is dependent on the shown processes. If you want to show fewer variants, more, the top ten or the most common process variant, use the corresponding button on the left bar. |

Selection:
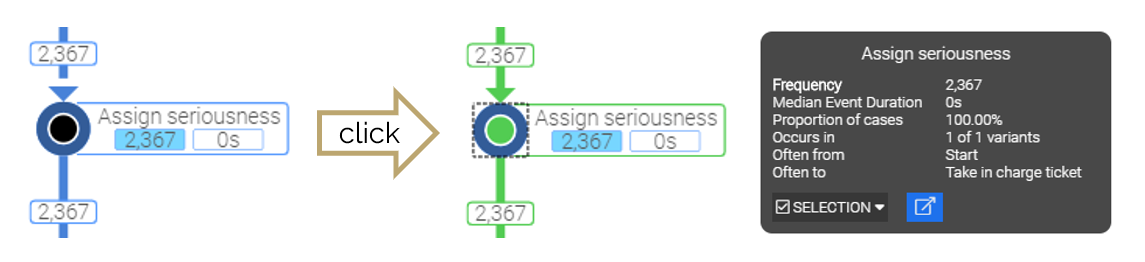
You can click on an activity or edge in the Process Analyzer to see context information.
Activity Node |
Edge |
•Inner circle: oChanges shade from light to dark as its measure increases oTo change the measure associated with the inner circle, click on the burger symbol, then the nodes symbol, then choose the between the measure options in the list. •Outer donut oShows a colour-grading scale that will fill in as its measure increases oReflects the third measure in the node's Context Menu popup box •In the Context popup box is a button "SELECTION" where you can select the process variants with or without this activity or the process variants which start or end with this activity. •The blue button allows you to go to the sheet "Activity Details" with this selection. |
•Shows the flow from one activity to another •Key figure: Displayed as a label. Default setting: Frequency •An edge will get thicker as its measure increases •Solid lines: edges that join two real activities in a process •Dashed lines: oJoin the Start node to any activities that begin a process oJoin any final activity to the End node oThe Start and End nodes are not actual activities in the process so the dashed lines help to find the actual beginning and end activities •Clicking on an edge highlights it and allows you to open an Edge Context popup window oShows various measures such as Frequency, AVG Idle Time, Proportion of Cases oUse the "SELECTION" button to filter cases further based on whether this edge is or is not included in the process. |
For more information, see the Process Analyzer section in the Business Analyst Guide.