|
Features |
Scroll Previous Topic Top Next Topic More |
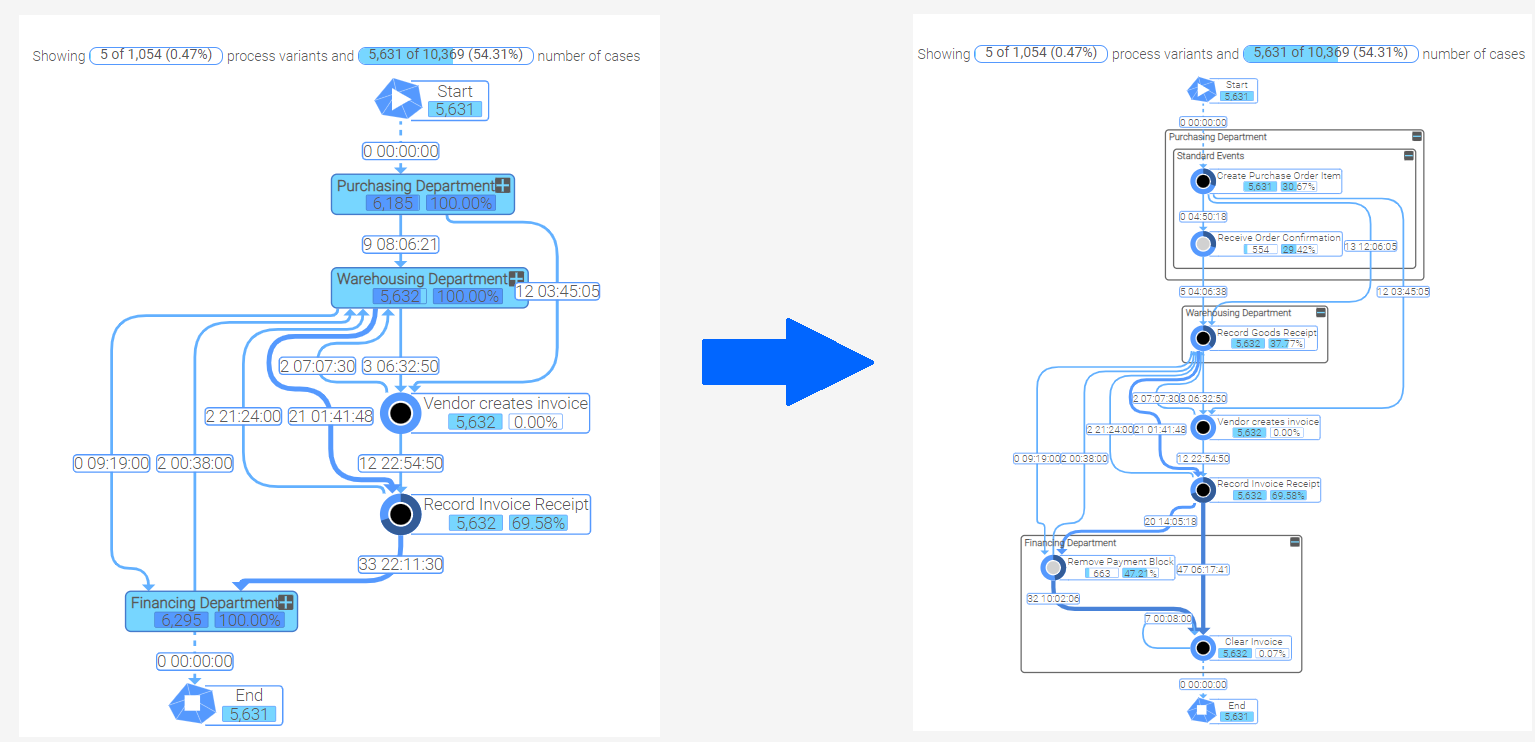
Grouping
Grouping can be used to put multiple activities into a group to get a better overview of a process. The groups can be collapsed/expanded via the respective buttons. Each group has a button in the top right corner. Furthermore, there are two new buttons in the sidebar to collapse/expand multiple groups at once. These buttons will collapse/expand groups of the same layer (first collapse all child nodes, then all parent nodes).
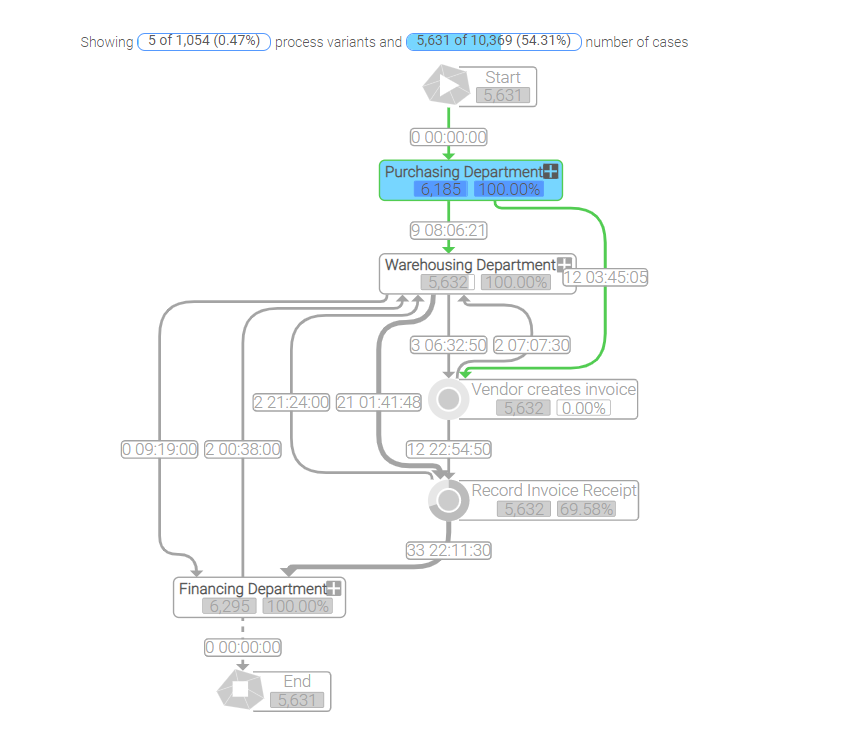
Highlighting
The new highlighting feature creates a better visibility of the additional process variant when clicking the button 'Show More' of the sidebar. The new variant is colored with the default color of the graph and all remaining nodes and edges (“old” variants) are displayed in grey. Additionally, completely new nodes/edges within the new variant (didn’t occur before) are highlighted with a highlight color to show what elements were added to the graph. A click on the “white” background will reset all graph colors to default.
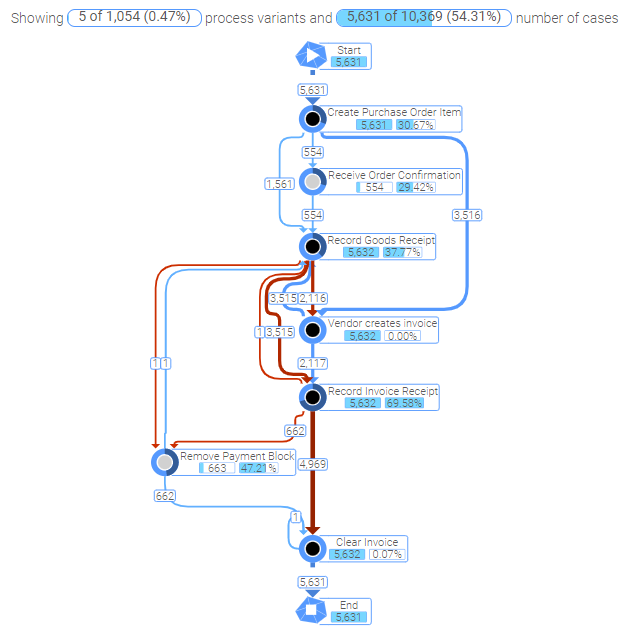
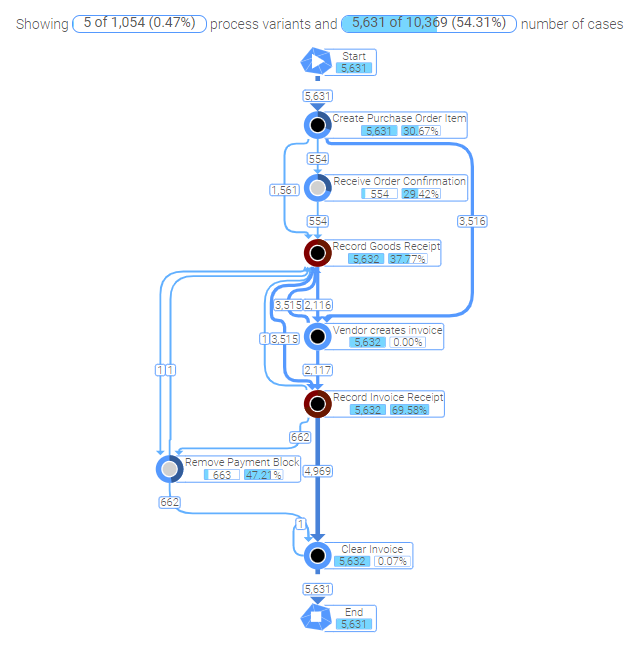
Color coding for events or activities
When you switch to the Process Analyzer edit mode, you can color nodes and edges to your preferences. Using the color codes provided by Qlik, any activity-related metric can be calculated. In the following example: the nodes that start with "Change" or "Delete" are colored red, while the others retain their original color.. The same applies to the edges in the figure on the left. This is ensured by the following if expression:
=If(wildmatch(ActivityType,'Record*'),red())
|
|
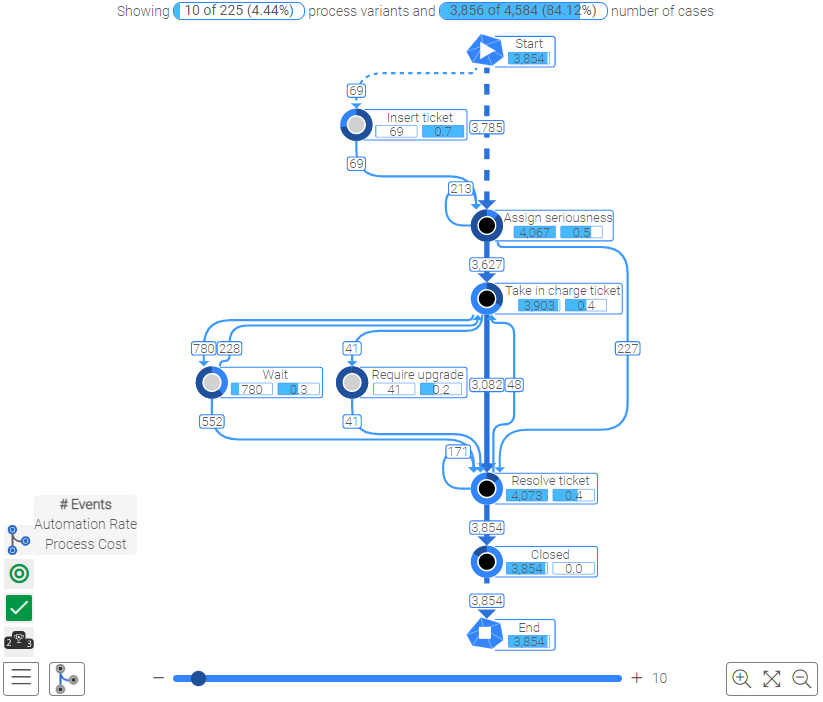
Change the measures on the nodes
In the edit mode of the Process Analyzer, the measures and dimension of the nodes and edges can be adjusted to your preferences. You just have to use the correct expression to adjust the measure and give it a meaningful label. In the example below, the measure "# Events" was changed to "Automation Rate" and "AVG Event Duration" to "Process costs".
The following code was used to define the automation rate:
num(Sum({<RealUser={0},ProcessPathUniqueNo={$(mw_selectedProcessPaths)}>}RealNode)/Sum({<ProcessPathUniqueNo={$(mw_selectedProcessPaths_s)}>}RealNode),'#' & ThousandSep & '##0'& DecimalSep & '0')
This code was used to calculate the process costs of an activity by multiplying the work force cost with the duration of the activity. The work force cost is calculated as the cost of a full time equivalent of 45.000€ is divided by 220 workdays, 8 hours per workday and 60 minutes per working hour:
num(Sum({<ProcessPathUniqueNo={$(mw_selectedProcessPaths)}>}ProcessStepDuration * (45000/ 220 / 8 / 60), '#' & ThousandSep & '##0')
OCPM |
|
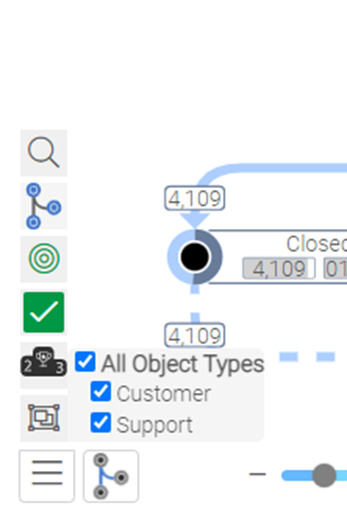
•The Object Type filter can be used to show only a subset of the available objects if wanted. |
|