|
Process Mining Dashboard |
Scroll Previous Topic Top Next Topic More |
Functions
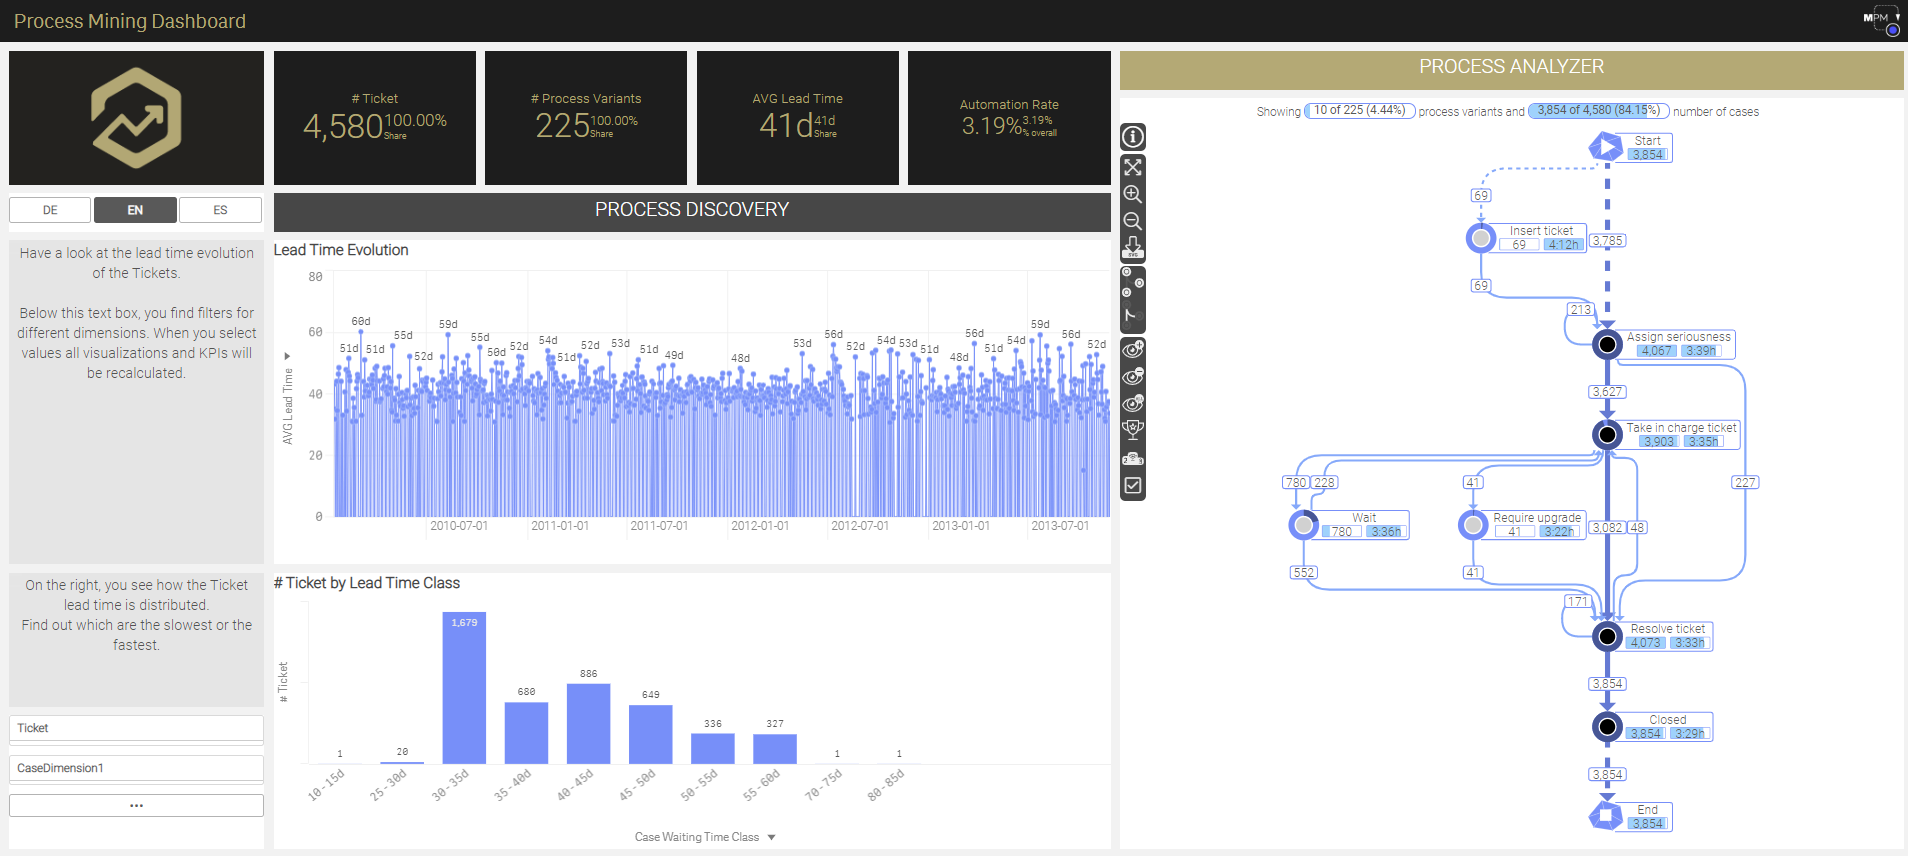
▪Display of the most frequent process variants
oInteractive selection
oMain KPIs combined with process analysis
▪Selection of all visualizations as filter
oPossible filters: time, suppliers, material groups, locations, company codes, purchase orders
Business Benefit
•Identification of the most interesting process variants
oLong runner/cycle times
oMost/rarest process variants
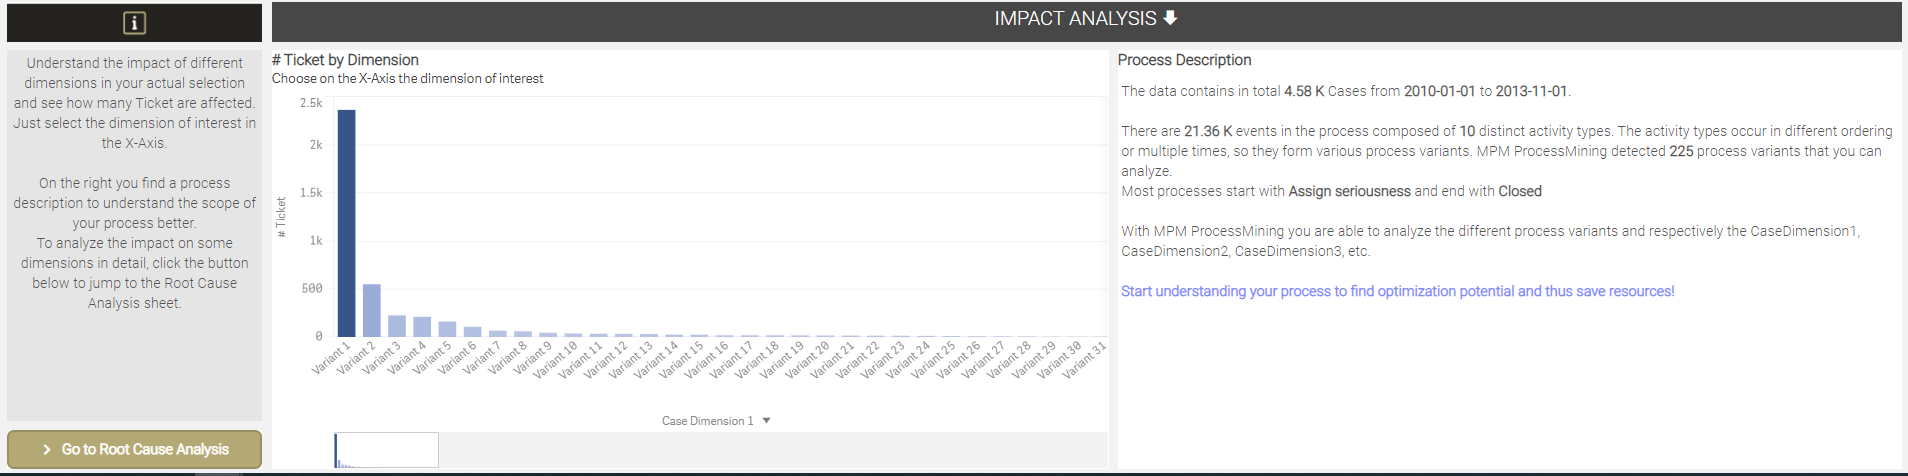
•Impact Analysis
Tutorial
Start the video below to see a short tutorial about how to use the sheet.