|
Overview |
Scroll Previous Topic Top Next Topic More |
mpmX has always pursued the approach of self-service process mining. Our software is designed to enable users to build the required dashboards themselves with minimal effort. You can find out how this works in the following section.
Right-click on the dashboard in the app overview and select Open and edit to open the first worksheet. The worksheet is still empty.
The following explanations refer to a sample data set that contains the sales data of a company.
Standard editing mode and advanced editing mode
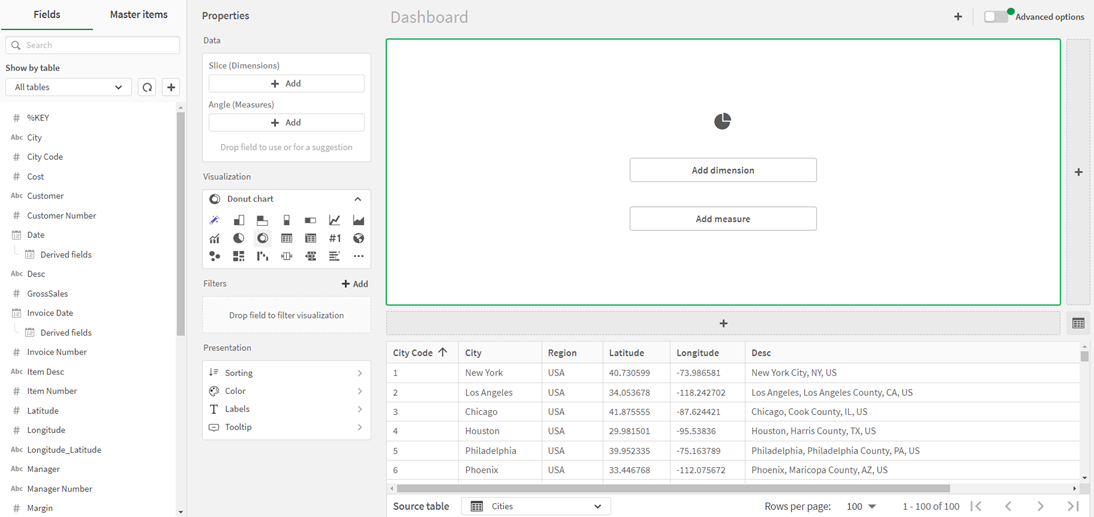
In this section, you will use a combination of the standard editing mode and the advanced editing mode. Standard mode allows you to quickly create content, while advanced mode provides options for fine-tuning visualizations and a more detailed layout of worksheet objects. You can also create chart formulas in advanced mode. You can switch between these modes using the Advanced options button.
Start working in standard editing mode. Once you have created your visualizations, use the advanced editing mode to customize them.
From left to right, the standard editing mode has the following layout:
1.Fields
2.Master Elements
3.Properties
a.Dates
b.Visualizations
c.Filter
d.Presentation
4.Worksheet area
a.„Advanced Options“ button
b.The Worksheet you are designing
c.The source data table
Dashboard1
Fields, Dimensions and KPIs
Visualizations are created using fields, dimensions and KPIs.
Field
A field is a data object with values that are loaded from a data source. Basically, a field corresponds to a column in a table. Fields are used to create dimensions and KPIs in visualizations.
Dimension
A dimension is an element for categorizing data in a chart. For example, the sections in a pie chart or the bars in a bar chart represent individual values in a dimension. Dimensions are often individual fields with discrete values, but can also be calculated in a formula.
KPIs
A Key Performance Indicator is a calculation based on one or more aggregations. For example, the sum of sales is a single aggregation, while the sum of sales divided by the number of customers is a measure based on two aggregations.