|
Visualization |
Scroll Previous Topic Top Next Topic More |
Activity |
|
•Is displayed as a node in the diagram •Consists of the donut chart, the inside of the donut chart, the name of the activity and certain key figures •Inner circle: oChanges shade from light to dark as its measure increases oTo change the measure associated with the inner circle, click on the burger symbol, then the nodes symbol, then choose the between the measure options in the list. •Outer donut oShows a colour-grading scale that will fill in as its measure increases oReflects the third measure in the node's Context Menu popup box •Key figure 1: Displayed on the left side. Default setting: Frequency •Key figure 2: Displayed on the right side. Default setting: Average processing time •Key figure 3: Displayed in the donut chart and must therefore be a relative key figure. It can be filled differently depending on the scenario. Default setting: Relative share of cases that contain this activity •Clicking on a node opens the Context Menu popup box |
 |
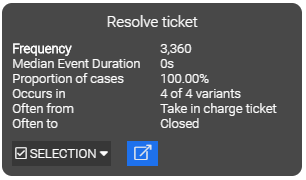
Context menu of the activity |
|
•Display of the three key figures of the activity •The first measure is visually shown by the darkness of the shade of the node's inner circle. •"Occurs in": Specifies the number of displayed process variants in which the activity is contained •"Often from": Specifies the most frequent predecessor •"Often to": Specifies the most frequent successor •"SELECTION": Four selection options: 1. processes that contain this activity, 2. processes that do not contain this activity, 3. processes that start with this activity and 4. processes that end with this activity •Button 1: Jump to a stored worksheet and select the activity •Button 2: Jump to a deposited worksheet without selection |
 |
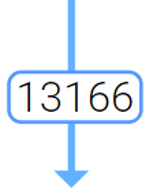
Edge |
|
•Lines that indicate an Activity transition •Key figure: Displayed as a label. Default setting: Frequency •An edge will get thicker as its measure increases •Solid lines: edges that join two real activities in a process •Dashed lines: oJoin the Start node to any activities that begin a process oJoin any final activity to the End node oThe Start and End nodes are not actual activities in the process so the dashed lines help to find the actual beginning and end activities •Clicking on an edge highlights it and allows you to open a popup window oShows various measures such as Frequency, AVG Idle Time, Proportion of Cases oYou can filter cases further based on whether this edge is or is not included in the process |
 |
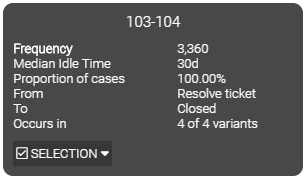
Context menu of the edge |
|
•Display of the three key figures of the edge •"From": Specifies the predecessor •"To": Specifies the successor •"Occurs in": Specifies the number of displayed process variants in which the activity is contained •"SELECTION": Two selection options: 1. processes that contain this edge and 2. processes that do not contain the edge •Button: Jump to a deposited worksheet |
 |