|
What-If Analysis with AutoML |
Scroll Previous Topic Top Next Topic More |
Qlik AutoML is a powerful tool that makes it easy for analytics teams to generate models, make predictions and test business scenarios without having to write code.
We utilise the power of the Qlik Server-Side Extension (SSE) to create a simple dashboard for scenario analysis directly in Qlik Sense.
"What-if" scenarios are a great way to plan decisions and actions by testing different parameters using AutoML's prediction API.
What is SSE?
The Server-Side Extension (SSE) protocol allows us to extend Qlik's built-in expression library with functions from external calculation programmes. In our case, we will use AutoML's recalculation of the prediction based on variable changes to display the result in a KPI chart.
Let's walk through the process using a practical example. We will look at the risk of employee turnover (data set at the end of the article).
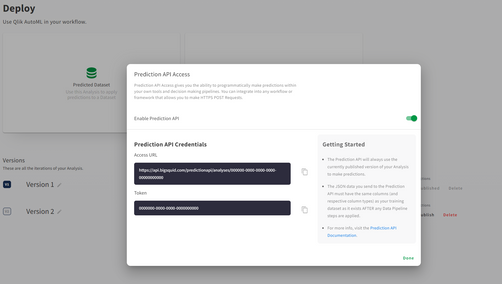
1.Create your AutoML project and load the data set. Make sure that you select the "left" field as the target. Once you have successfully completed the training process, deploy your model and enable API access. Make a note of the access URL and token as we will need these to establish the connection in Qlik Sense.
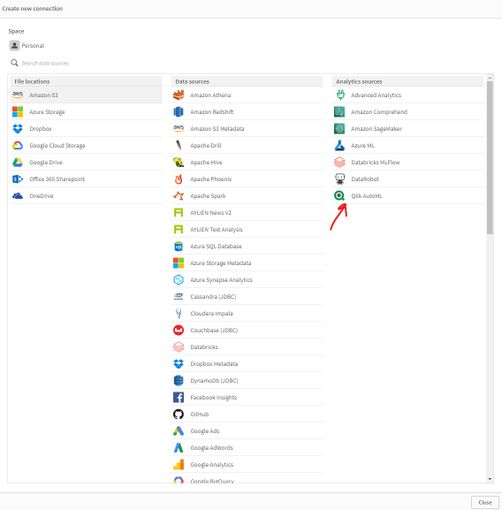
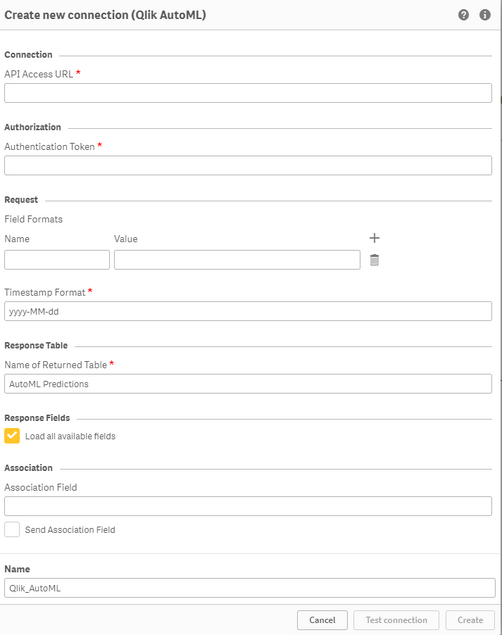
2.In our QS tenant, we need to create a new data connection via the "Qlik AutoML" Analytics source connector. If you don't see it, make sure you enable machine learning endpoints in the Management Console.
3.Now let's create our scenario analysis sheet in the Qlik Sense app.
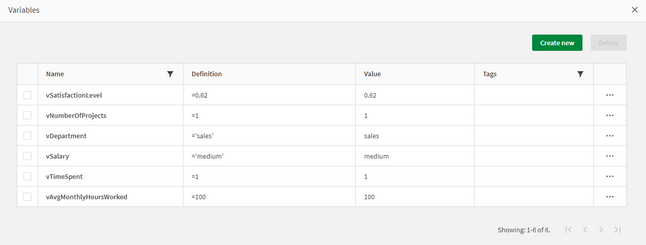
oFirstly, we create several variables that are used in our "Variable Input" objects. We focus on the features that are more important according to the feature importance table.
oNext, we create our objects:
▪The KPI that shows the likelihood of employees leaving is based on a measure that uses the SSE expression as follows, with some of the characteristics passed as variables.
P.S.: Note that the first argument of ScriptEvalEx must match the field types of our features - where N is a number and S is a string. In addition, the features passed as the third argument must match AutoML 1 to 1; missing features will result in an error.
=endpoints.ScriptEvalEx('NNNNNNNSS','{"RequestType":"endpoint", "endpoint":{"connectionname":"Qlik_AutoML_Employee_Turnover","column":"probability_yes"}}',
vSatisfactionLevel AS satisfaction_level,
last_evaluation,
vNumberOfProjects AS number_project,
vAvgMonthlyHoursWorked AS average_monthly_hours,
vTimeSpent AS time_spend_company,
Work_accident,
promotion_last_5years,
vDepartment AS sales,
vSalary AS salary)
▪Next, let's create our variable inputs using the Variable Input chart under Custom Objects > Qlik Dashboard Bundle. Customise the "Display as" type as required.
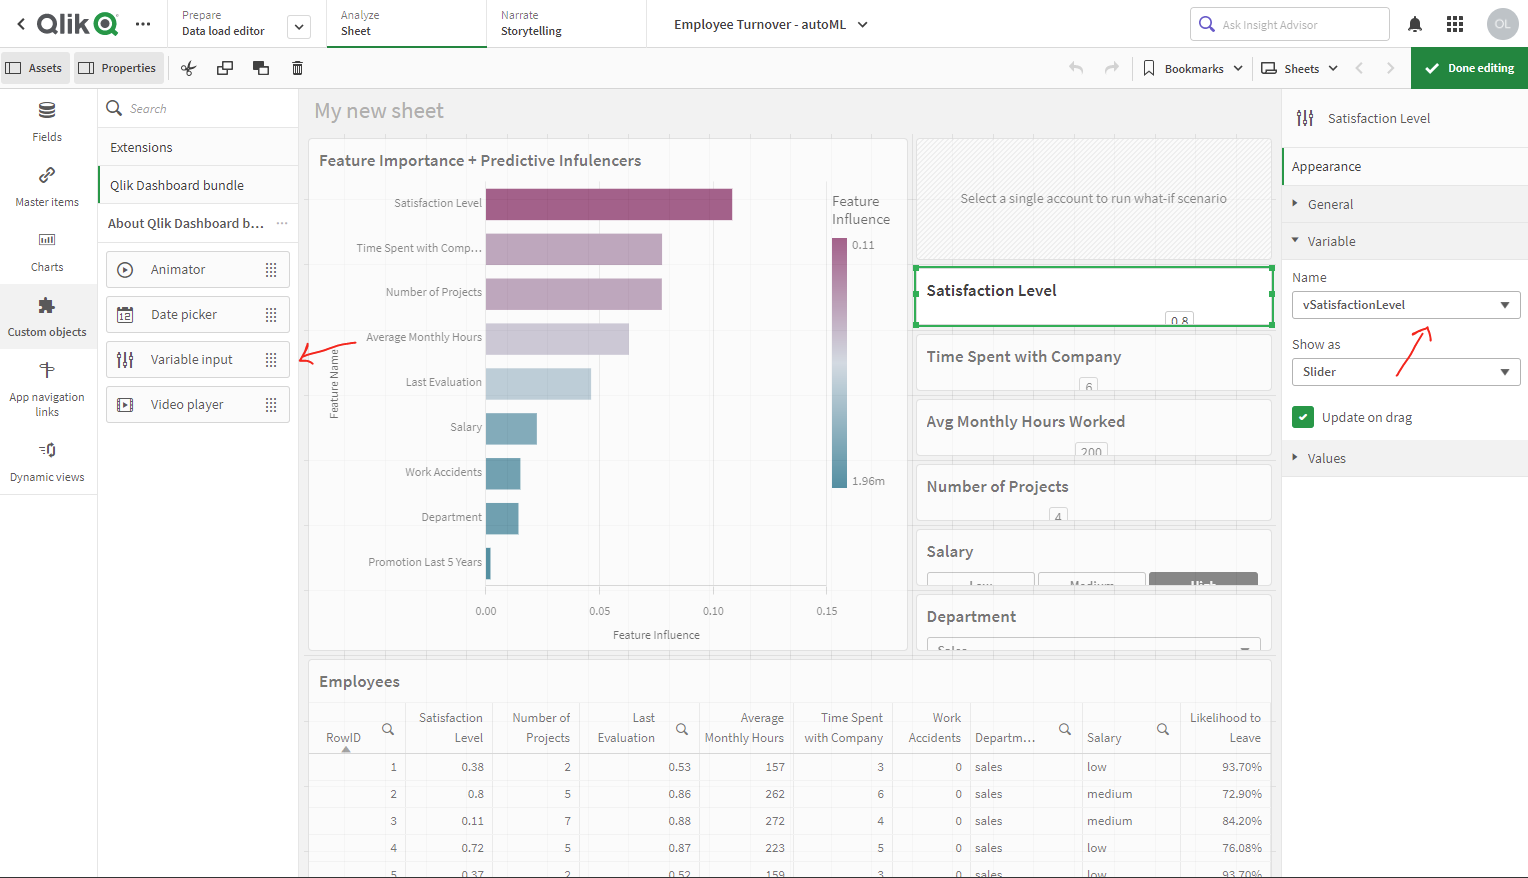
You can now customise the variables to trigger AutoML, which will automatically redistribute the data and re-predict the outcome to understand the impact of possible actions.